Monpazier Fact File
- Bella Fricker

- Aug 27, 2024
- 5 min read
Updated: Apr 23, 2025
It is sooo exciting that the Endurance World Championships are so close to home AND that I am getting to crew my friend Shanti Roos, riding for the Netherlands. IF I was lucky enough to have a horse at this level right now and to be selected this is the kind of research I would be doing to inform my training decisions and race strategy.
This blog is a little fact file for you as well as review of the previous five year’s worth of results to give an indication of the speed…

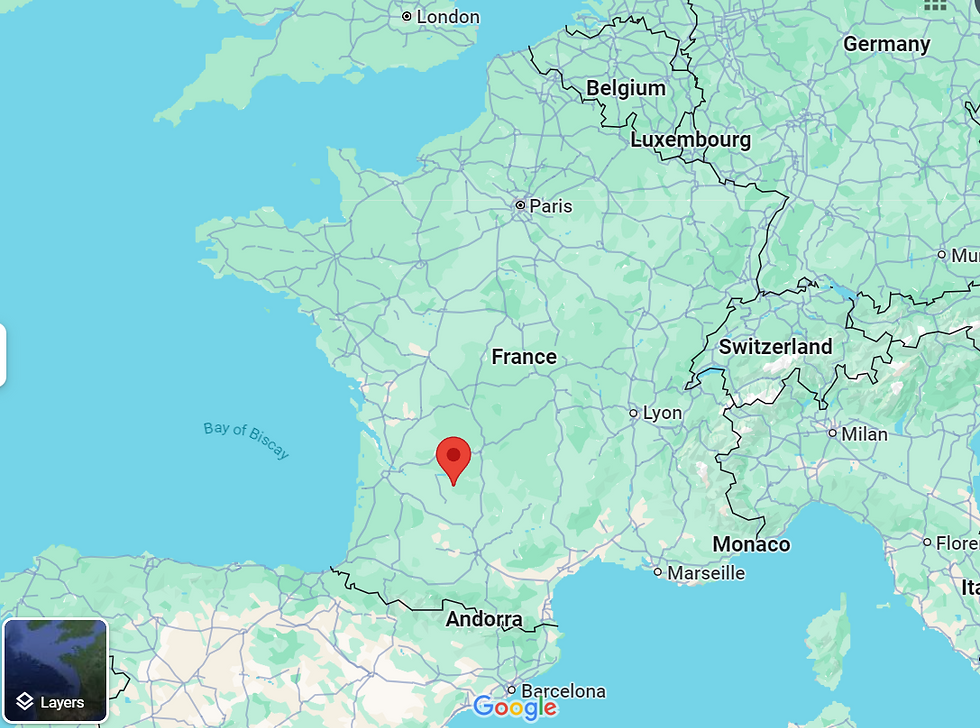
Location/Travel
Monpazier is in the south of France in the Dordogne region. I would say it would take around 12hrs to get there from Calais. For UK horses with the 1.5hr ferry and the journey UK side to Dover, I’d be splitting this journey into two days OR travelling a good 2 weeks early to allow the horses to recover from this journey. The nearest airport is 40km away, Bergerac. This happens to be the one I am flying into this year!
Terrain
Described in the FEI schedule as ‘FOREST, SAND and EARTH’ but we all know it has some hills and climbing to account for. Previous schedules have listed ‘Altitude differentials 900 à 1200 métres’ so for sure there’s going to be some climbing. The average speeds of this race back that up.
Weather
Lovely sunny south of France – the weather forecast for ride day (7th September) is currently forecast to be 28°C. For a start, it’s going to be a notably hotter than our average UK temperatures. I would have been heat training all summer – actively training in the hottest parts of the day with rugs on and coats on myself!


Past results
Monpazier has been running every year since 2003 and has actually never missed a year – even in 2020 they managed to go ahead. This gives us a HUGE pool of data to review the results and formulate some averages – which helps to formulate a ride strategy. Because I’m not actually riding myself I’m not going to review the results from EVERY year, just the 160kms since 2018 as this should still give us more than enough insight + of course the all important test event that ran last year. Championship 160kms now are 6 loopers, so Monpazier has had to adjust from it’s usual five. We saw this ‘tested’ out in 2023 but actually it didn’t make a big difference to the data sets…
2018
Winning speed: 19.02 kmph
Completion rate: 65.52%
GA: 27.59%
RET: 6.90%
| Completion | Top 10 | FTQ |
Gate 1: 39km | 14.69 | 15.93 | 15.40 |
Gate 2: 32km | 16.98 | 17.76 | 17.30 |
Gate 3: 27km | 19.37 | 20.81 | 19.71 |
Gate 4: 32km | 17.09 | 18.28 | 16.53 |
Gate 5: 30km | 19.74 | 22.32 | 17.52 |
Average | 16.91 | 18.37 | 17.17 |
2019
Winning speed: 18.93 kmph
Completion Rate: 34.5%
GA: 14.5%
RET: 18%
MET: 33%
| Completion | Top 10 | FTQ |
Gate 1: 39km | 15.70 | 16.30 | 14.45 |
Gate 2: 32km | 15.81 | 16.40 | 14.59 |
Gate 3: 27km | 18.32 | 18.71 | 17.68 |
Gate 4: 32km | 18.95 | 19.69 | 17.64 |
Gate 5: 30km | 19.08 | 22.28 | 16.85 |
Average | 17.18 | 18.45 | 16.12 |
2020 – note a small change in loops vs previous two years.
Winning speed: 18.99 kmph
Completion Rate: 50%
GA: 15.8%
RET: 21.1%
MET: 5.3%
DSQ: 2.6%
WD: 2.6%
FTC: 5.3%
| Completion | Top 10 | FTQ |
Gate 1: 40km | 17.16 | 18.15 | 17.45 |
Gate 2: 33km | 17.01 | 17.68 | 16.88 |
Gate 3: 27km | 17.68 | 17.96 | 17.89 |
Gate 4: 33km | 17.48 | 18.30 | 17.45 |
Gate 5: 27km | 22.24 | 23.50 | 19.13 |
Average | 17.91 | 18.79 | 17.76 |
2021
Winning speed: 19.55 kmph
Completion Rate: 49%
GA: 20%
RET: 10%
MET: 7%
FTC: 9%
WD: 5%
| Completion | Top 10 | FTQ |
Gate 1: 40km | 16.48 | 17.36 | 16.70 |
Gate 2: 33km | 18.47 | 19.27 | 16.39 |
Gate 3: 27km | 19.11 | 20.32 | 18.15 |
Gate 4: 33km | 18.81 | 20.34 | 17.60 |
Gate 5: 27km | 18.68 | 22.73 | 17.07 |
Average | 17.71 | 19.06 | 17.03 |
2022 – really low entry numbers, small variations on loops.
Winning speed: 19.12 kmph
Completion Rate: 34%
GA: 38%
RET: 11.5%
MET: 8%
DSQ: 4%
| Completion | Top 10 (same as completions since there were only 8) | FTQ |
Gate 1: 40km | 17.52 | 17.52 | 17.65 |
Gate 2: 32km | 19.56 | 19.56 | 19.75 |
Gate 3: 28km | 18.34 | 18.34 | 18.37 |
Gate 4: 32km | 17.99 | 17.99 | 17.14 |
Gate 5: 28km | 17.73 | 17.73 | - |
Average | 17.19 | 17.19 | 18.11 |
2023 Test Event - now a 6 loop 160km
Winning speed: 18.72 kmph
Completion Rate: 44%
GA: 39%
RET: 11%
MET: 6%
| Completion | Top 10 | FTQ |
Gate 1: 39km | 15.89 | 16.47 | 15.79 |
Gate 2: 20km | 15.64 | 16.25 | 15.46 |
Gate 3: 32km | 17.33 | 17.89 | 16.72 |
Gate 4: 20km | 16.48 | 17.82 | 17.08 |
Gate 5: 23km | 16.80 | 18.31 | 16.20 |
Gate 6: 26km | 17.96 | 21.53 | 15.78 |
Average | 16.58 | 18.18 | 16.02 |
What does this data tell us?
Winning Speeds: - The winning speeds have generally been consistent, ranging between 18.72 kmph (2023) and 19.55 kmph (2021).
- Despite the variations in the course (e.g., changes in loop distances), the winning speeds remain within a relatively narrow band, indicating consistent performance among top competitors.
Completion Rates:
- 2018: The highest completion rate was 65.52%, with a steady average speed across gates.
- 2019: Saw a significant drop to 34.5%, indicating potentially more challenging conditions.
- 2020 & 2021: Showed an improvement, with completion rates of 50% and 49% respectively.
- 2022: Dropped again to 34%, possibly due to lower entry numbers and variations in loops.
- 2023: Showed a recovery with a 44% completion rate, despite the introduction of a 6-loop 160 km course for the test event.
Loop Analysis:
- The average speeds per gate have varied, with the last loop as we often see, being one of the faster gates across the years, especially in 2020 (22.24 kmph for completions).
FTQ Rates:
- The FTQ (Failed to Qualify) rates tend to be associated with significant drop-offs in average speed at later gates, particularly noticeable in 2023 at Gate 6.
- The year 2022 saw a unique pattern where the completion and Top 10 speeds were identical due to low entry numbers, which impacted the competition dynamics.
General Observations:
- Variability in completion rates suggests changing course conditions or strategies, with notable challenges in 2019 and 2022.
Overall, the competition at Monpazier has seen consistent winning speeds but fluctuating completion rates, with course variations influencing strategic approaches by competitors. The FTQ data provides insights into the challenges faced during specific stages, particularly in the final loops.
It seemed logical to then go and review the data from the previous world championships to see if there were some trends that would also inform the strategy at Monpazier – despite such variation in courses!
If you enjoyed this content and would like to support more blog posts like this, consider buying me a coffee! Your contribution helps keep the site going and ensures I can continue creating valuable content for you. Thank you for your support! ☕💛


Comments